
BROS: Grounds for concerns
GLP-1 adoption the street has slept on, $3bn of lease liabilities disguised as capital-light growth, and a fortressing strategy cannibalising its own comp base make Dutch Bros a compelling 27% short.

Dutch Bros Inc. (NYSE: BROS) – Short
Target Price: US$40.75
Downside: 27.0%
Note: All values in US$mm unless stated otherwise. Figures are accurate as of 11/06/2026.
Executive Summary
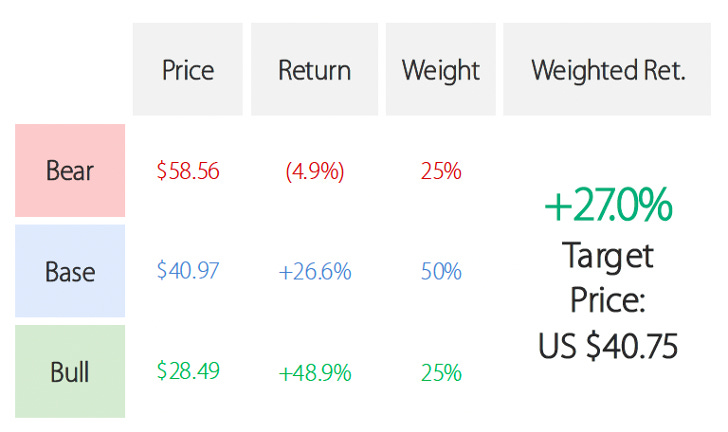
We are pitching a short on Dutch Bros Inc. (NYSE: BROS), with a blended target price of US$40.75, representing 27.0% downside from the current share price of $55.83.
Dutch Bros operates 1,177 drive-thru beverage shops across 25 states, generating $1.64bn of FY2025 revenue. The company has become a cult favourite amongst growth investors, with the Street overwhelmingly bullish at a 92% Buy/Strong Buy consensus and a mean price target of $75.80.
We take the view that the market is pricing in a near-perfect execution scenario, sustained mid-20% revenue growth, extensive store expansion, and ~30% contribution margins — none of which we believe is achievable. The stock trades at 29.5x EV/EBITDA, a significant premium to peers including Starbucks (24.2x) and McDonald’s (16.9x), and 6-7x the S&P Beverages index at 3.6x. A reverse DCF of the current share price implies a 5-year revenue CAGR of 34.2% and a Year-5 EBIT margin of 14.8% — both materially above our estimates of 22.8% and 10.6% respectively.
Our short thesis rests on three structural mispricing points, each of which consensus has dismissed, understated, or outright ignored.
· GLP-1 adoption is a structural demand headwind that inflects from niche to mass in exactly the 2026–27 window, aimed squarely at BROS’s most calorie-dense, highest-frequency customers. Consensus models ~4–5% long-term SSSG with zero GLP-1 drag.
· The Build-to-Suit (’BTS’) strategy is financial engineering, not ‘capital-light’ growth. It flatters near-term CapEx and reported ROIC while loading the balance sheet with long-duration, non-cancellable lease claims — creating a concentrated refinancing wall in 2030 that the Street has ignored.
· The ‘Fortressing’ densification strategy cannibalises the comp base. New stores are systematically opening below the system average AUV, geographic mix-shift into lower-income southern states is dilutive by construction, and the path to management’s 30% contribution margin target runs straight into structurally higher occupancy costs and reversing labour leverage.
Combined, these three forces create a scenario in which SSSG disappoints, contribution margins compress rather than expand, and the incremental return profile of new stores deteriorates — yet the company continues to open ~200 shops per year, destroying economic value with each new unit at the margin. Under our base case scenario, we arrive at a target price of US$40.75 (27.0% downside) across our probability-weighted scenario analysis (25% bull at $58.56, 50% base at $40.97, 25% bear at $28.49).
Industry Overview
Dutch Bros occupies a distinctive niche in the US food & beverage landscape — the drive-thru-only beverage chain. Unlike traditional coffee incumbents such as Starbucks, which operate large-format stores with meaningful indoor seating and a diversified food offering, drive-thru beverage chains derive their unit economics from transaction throughput, beverage customisation, and visit frequency. The revenue ceiling of a drive-thru format is hard — there is no dine-in optionality, no food pull-through at scale, and revenue per square foot is entirely dependent on car volume and ticket size.
This model delivers structurally higher margins at a per-unit level when stores are scarce and demand is concentrated. However, it is acutely sensitive to cannibalization once the store network begins to densify, a risk that is central to our thesis.
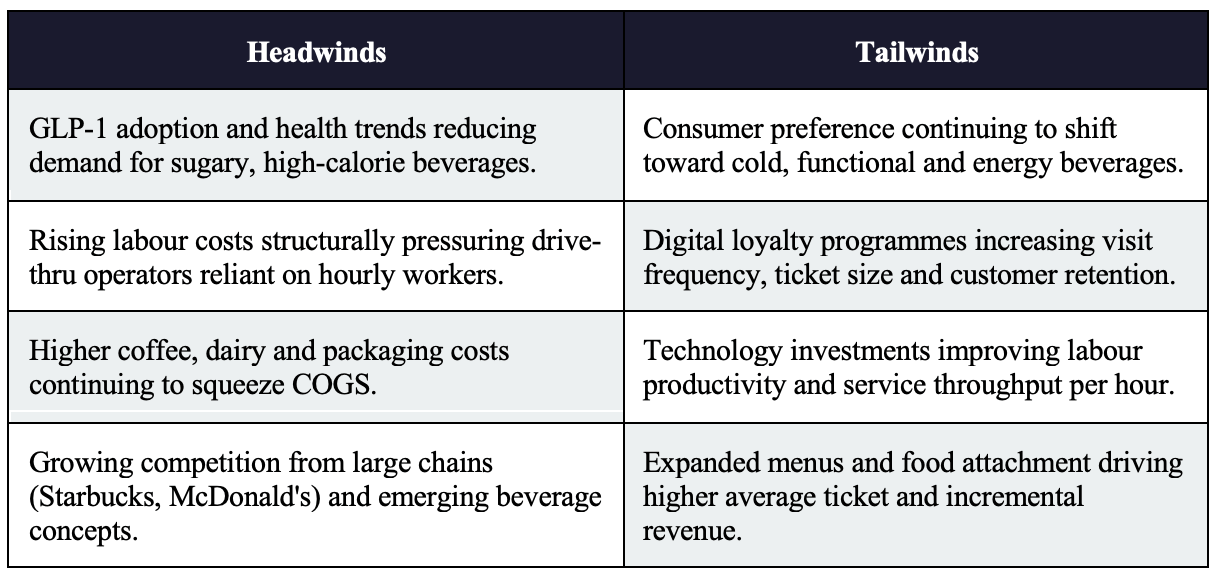
The broader quick-service restaurant and beverage sector is navigating a complex operating environment:
Despite the company’s EV/EBITDA multiple nearly halving from over 40x in mid-2024 to the current 23.56x (as of our analysis date), Dutch Bros continues to trade at a 6–7x premium to the S&P 500 Soft Drinks & Non-alcoholic Beverages index.
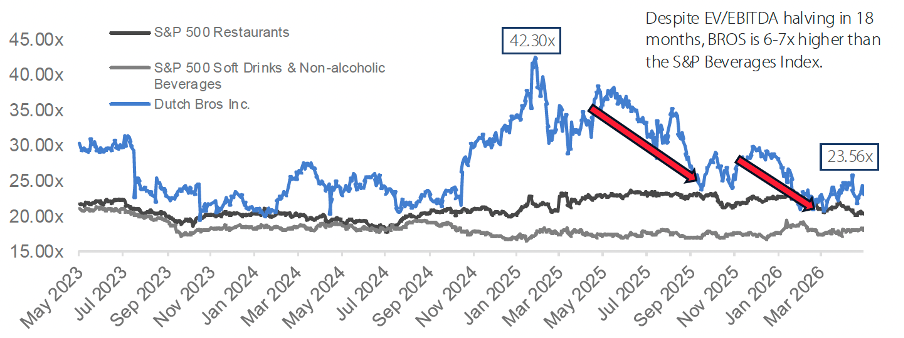
This premium is predicated entirely on the market’s belief in near-perfect long-term execution, a belief we fundamentally challenge. The S&P 500 Restaurants index trades at ~20x EV/EBITDA; BROS’s premium to this is substantial, and we see no credible path to justifying it given the structural headwinds we outline below.
Across the sector, we see the rise in GLP-1 Adoption structurally eroding demand. BROS takes the biggest hit granted it has the highest sugar (g)/ drink amongst its peers.
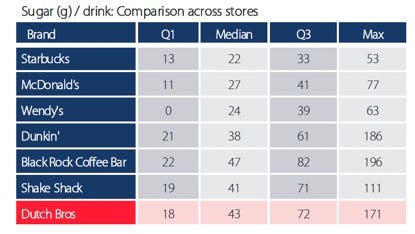
GLP-1 drugs reduce appetite, slow digestion, and curb cravings for high-calorie and sugary foods. As adoption expands and prices decline, consumers may increasingly shift toward lower-sugar beverages and smaller portions. Shake-focused brands and energy drink menus tend to have much higher sugar density than traditional coffee chains. Dutch Bros’ high-sugar menu profile thus leaves the company disproportionately exposed to changing consumption habits.
Company Overview
Dutch Bros operates 1,177 drive-thru beverage shops across 25 US states. Of these, 844 are company-operated (72% of units, generating 92% of revenue) and 333 are franchised (28% of units, 8% of revenue). The product mix is approximately 50% custom espresso-based beverages, 25% Blue Rebel energy drinks, and 25% cold brew, refreshers and teas. Food has now been introduced across 485 locations, though its contribution remains marginal.
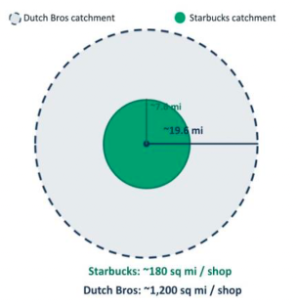
The brand differentiates on the ‘Broista’ service culture and deep Gen Z identity, which has successfully driven an Average Unit Volume (AUV) of $2.16m in FY2025, meaningfully above both Starbucks (~$1.8m) and Dunkin’ (~$1.3m). However, this AUV premium is a function of scarcity: BROS stores cover approximately 1,200 square miles per location in Texas (its strongest market), versus ~180 square miles for Starbucks. As the company densifies its network under the ‘fortressing’ strategy, the structural scarcity that underpins those AUVs will erode.
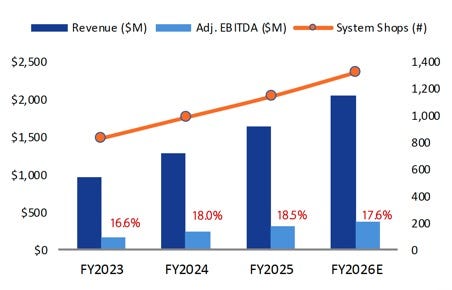
Revenue has compounded at ~30% from FY2023 to FY2025, driven almost entirely by unit growth rather than organic same-store productivity. The system shop count expanded at 17% per annum (831 → 1,136 shops) over the same period. Adjusted EBITDA margin has stalled at approximately 18% and is guided to compress by ~60bps in FY2026E to 17.9%, the opposite of the operating leverage trajectory the market is pricing.
The corporate governance picture is materially worse than it first appears. Travis Boersma, the co-founder, has sold over $220m of BROS shares over the last two years, the majority at peak prices, a seemingly clear signal of insider conviction. The average tenure of board members sits at just 2.6 years (skewed by Boersma), with high churn as departing members sell shares on exit. This is a controlled company dynamic with the board under largely unilateral, relatively inexperienced hands.
Management compensation structures compound the problem: targets are split 50% on Revenue and 50% on Margins. This incentivises rapid store growth over the long-term sustainability of unit economics, precisely the wrong incentive structure given the cannibalization and AUV dilution dynamics we document below.
Market Expectations
The market’s current valuation implies a near-flawless execution of a very ambitious long-term plan. A reverse DCF of the current share price (~$55.83) requires a 5-year revenue CAGR of 34.2% and a Year-5 EBIT margin of 14.8%. Our own projections, which we believe are far more grounded in the operational realities of the business, imply a 5-year revenue CAGR of 22.8% and a Year-5 EBIT margin of 10.6%.
The sell-side consensus is overwhelmingly long: 92% Buy or Strong Buy ratings, with a mean price target of $75.80, implying ~50% upside from current levels. The three key debates driving the divergence between our view and consensus are:
SSSG durability: The Street continues to forecast ~4–5% long-term system same-store sales growth, despite clear evidence of maturation, rising cannibalization risk and expansion into lower-productivity markets. Our base case assumes SSSG of 3–4% before GLP-1 drag is applied.
Margin trajectory: ‘BROS reiterated the LT contribution margin target of 30%’ (Wells Fargo, February 2026). The Street, including UBS and JPMorgan, views BTS as capital-light and margin-accretive growth. We view it as financial engineering that structurally pressures store-level economics and actual cash returns.
Economic value creation: Is BROS earning returns above its ~14% cost of capital, or is growth destroying shareholder value? Strong EBITDA growth masks weakening incremental returns, raising the risk that every new store opened is destroying, not creating, long-term equity value.
The stock has undergone four distinct narrative phases since the 2021 IPO: a post-IPO de-rating as inflation exposed BROS’s lower-income customer base; a traffic-led re-rating as SSSG accelerated; a peak in the growth narrative as concerns about fortressing and competition emerged; and a more recent margin concern phase where the market notices occupancy pressure while still assuming strong long-term unit growth.
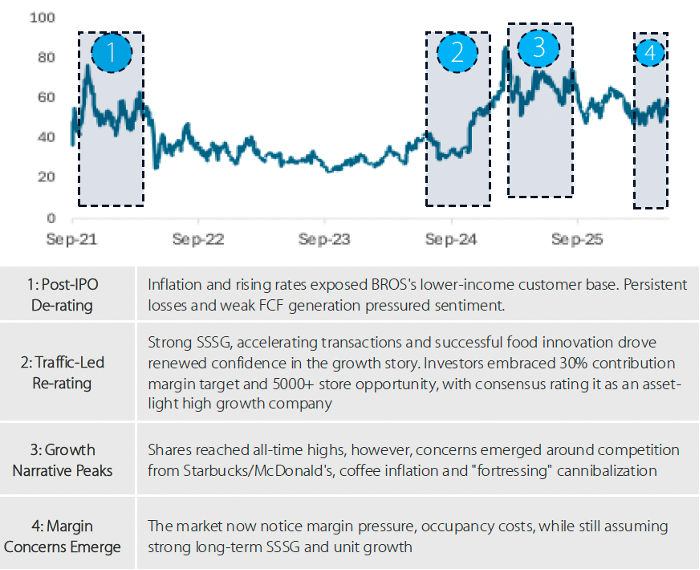
We believe the market is yet to fully reprice the structural headwinds we identify, and that the multiple compression has further to run.
GLP-1 Adoption Creates a Structural Demand Headwind
GLP-1 receptor agonists, including Wegovy and Ozempic, have been characterised by consensus as a niche, slow-moving risk to BROS, with any drag being ‘years away and easily offset by unit growth.’ We disagree. GLP-1 adoption is set to inflect from niche to mass precisely in the 2026–27 window, and BROS’s customer profile makes it uniquely and disproportionately exposed.
GLP-1 drugs work by reducing appetite, slowing gastric emptying and suppressing cravings for high-calorie, sweet-tasting food and beverages. Critically, this mechanism operates regardless of whether the sugar source is real sugar or a sugar substitute, pivoting to alternative formulations will not save BROS’s demand profile.
Dutch Bros’ menu is among the most calorically dense in the sector. With a median drink containing 43g of sugar and a maximum of 171g, BROS sits above Starbucks (median 22g), McDonald’s (27g) and even Shake Shack (41g). Shake-focused and energy drink menus structurally skew higher than traditional coffee chains — and BROS is squarely in that category.
The customer overlap is particularly damaging. Peer-reviewed research (Hristakeva, Liaukonyte and Fele, 2026) demonstrates that regular consumers of sweetened beverages are 5–15% more likely to be obese. Given that BROS’s top 20% of customers generate approximately 40% of system revenue, these ‘super-frequency’ customers are precisely the cohort most likely to be in the overweight-or-obese pool targeted by GLP-1 therapies. The revenue-weighted customer base of BROS has estimated obesity rates 1.3–1.6x the national average.
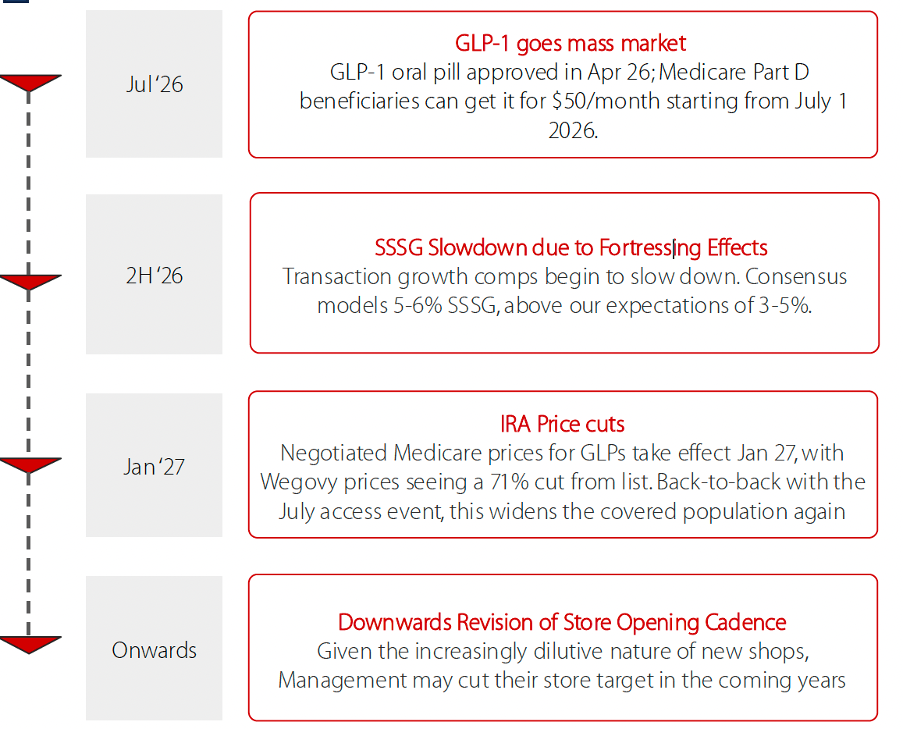
In addition, the GLP-1 access curve is undergoing a step-change in the second half of 2026. In April 2026, oral GLP-1 formulations received FDA approval; from July 1, 2026, Medicare Part D beneficiaries can access GLP-1 therapy at a $50/month copay. In January 2027, IRA drug price negotiations take effect, with Wegovy’s list price set to fall by ~71% to ~$675/month, dramatically expanding the addressable patient population. CMS negotiations in Q2 2027 are expected to broaden Medicare coverage further still.
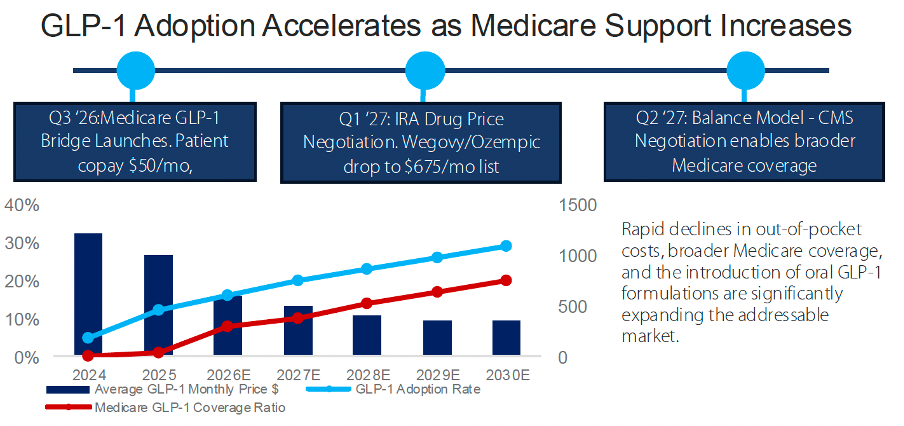
Rapid declines in out-of-pocket costs, combined with the convenience of oral formulations (removing the barrier of self-injection), will significantly accelerate adoption from the current base. Yet, consensus models zero GLP-1 drag in its SSSG forecasts.
Studies have shown that households with a GLP-1 user reduce expenditure on sweet drinks by up to 15%. Using a conservative 10% expenditure reduction rate and a 25% GLP population assumption by 2030, the implied SSSG drag is approximately 1.11%. Under a slightly more aggressive (but still conservative) scenario of 12.5% expenditure reduction with 25% population penetration, the drag reaches ~1.65%. Our base case drag on 2030 SSSG is approximately 1.2%, pulling consensus SSSG of ~3.4% down to a true SSSG of ~2.2%.
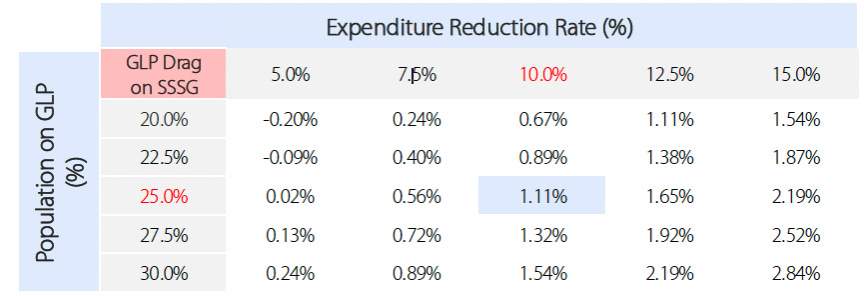
The Street is modelling ~4–5% long-term SSSG with zero GLP-1 adjustment. We see this as a ~200–300bps error, and it is one that will become visible in reported numbers over the next 12–24 months as the access and pricing catalysts above take effect.
Build-to-Suit is Financial Engineering, Not Capital-Light Growth
The Street has enthusiastically embraced Dutch Bros’ pivot to Build-to-Suit (’BTS’) lease arrangements as a capital-efficient route to accelerate store growth. JPMorgan cites ‘FCF turns positive in F26 as BTS cuts per-shop capex’ as a key bull thesis. UBS describes it as a ‘capital-light’ growth accelerant. Fidelity has accumulated 10.7% of Class A shares, partly on the BTS narrative. We believe all three are wrong, and that BTS is one of the most consequential misunderstandings in BROS’s investment case.
In a standard ground lease arrangement, Dutch Bros leases raw land and constructs the shop itself, incurring approximately $1.8m of CapEx. Under a BTS arrangement, a development partner builds the structure and Dutch Bros signs a 15–20 year non-cancellable triple-net lease, reducing upfront CapEx to ~$1.4m. On first glance, this looks like a $0.4m saving per store.
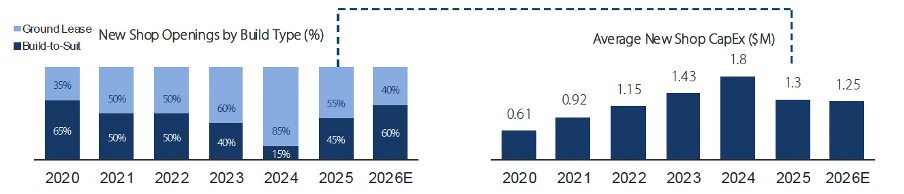
In reality, the trade is dramatically worse than it appears. The $0.4m CapEx saving is funded by:
+$1.2m of added lease liability per store (recognised on the balance sheet under IFRS 16 / ASC 842 equivalent)
+$363,000 of additional annual occupancy cost per store (an increase from ~$70k/year under ground lease to ~$140k/year under BTS NNN terms)
A NNN structure that also pushes property taxes, insurance and ongoing maintenance costs onto Dutch Bros
The per-store trade is NPV-negative once unit economics weaken and we believe unit economics are already past their peak. Roughly $170m of BTS lease obligations mature in 2030, the same year the $650m revolving credit facility comes due. This creates a concentrated refinancing wall against what we expect to be a falling FCF run-rate, a material and underappreciated balance sheet risk.
Operating lease liabilities have compounded at +27% per annum since FY2022 as Dutch Bros pivoted toward BTS. Q1 2026 saw the largest single-quarter step-up in the company’s history: a +$77m increase in one quarter (+16.5%) — roughly absorbing the entire FY2022 lease book in 90 days. Per the Q1 2026 10-Q: “most agreements are non-cancellable and carry initial terms of 15 to 20 years, with some extending through 2050.” Under our base case, total lease liabilities reach approximately $3.15bn by 2030, up from $83m in 2021.
Dutch Bros is targeting 60% BTS new store openings going forward, up from approximately 45% in 2025. The company’s own Q1 2026 disclosures confirm the impact: ‘...occupancy and other costs rose 130 basis points to 17.8% of company-operated shop revenues, primarily due to higher rent on new BTS shops.‘ This is not a transitory cost; it is a permanent structural increase in the occupancy cost line that will persist for the 15–20 year life of every BTS lease signed today.
Fortressing Cannibalises the Comp Base; New Stores Are Dilutive
BROS’s management targets 2,029 system stores by 2029, requiring 180–220 new openings per year. The company has branded its densification strategy ‘fortressing’, opening stores in clusters to improve brand awareness, logistics efficiency and labour training. The Street views this positively, and consensus assumes the strategy is net-beneficial to the system. Our alternative data and analysis suggests the opposite is true, and that fortressing is the primary mechanism by which contribution margins are being destroyed.
Alternative data analysis of BROS’s vintage cohorts reveals a critical structural inflection. Pre-2022 stores opened materially above the system average AUV and continued to ramp as they matured, benefiting from pent-up demand and novelty-driven pricing power. However, from the 2022–23 vintage cohorts onwards, new store AUVs crossed below the system average, a crossover point that coincides precisely with the acceleration of the fortressing strategy. The newest cohorts are opening approximately $0.3–0.5m below system average AUV, and the gap is widening.
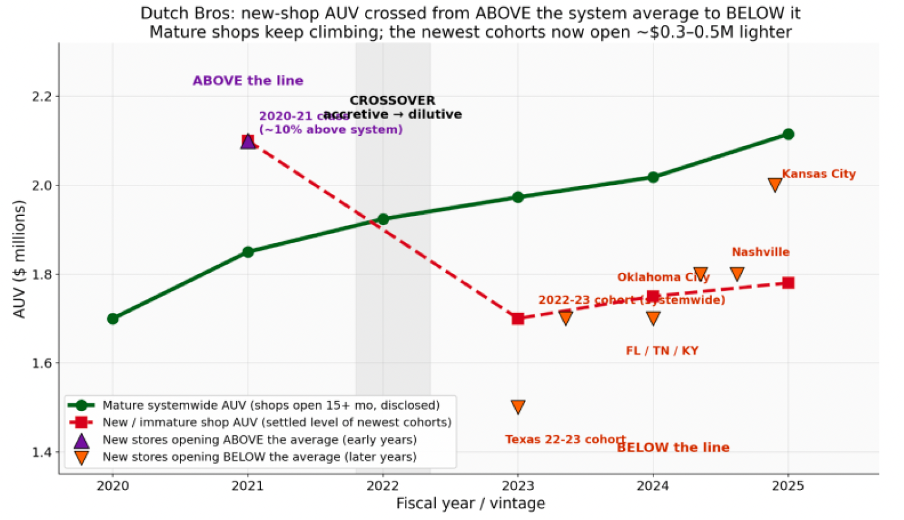
This has significant mechanical implications: every new store opened below the system average is mathematically dilutive to system-wide AUV and SSSG. Management is effectively destroying its own comparable base with every incremental store opening. The ‘inorganic’ growth from unit additions masks the organic deterioration.
BROS’s existing 1,177-store network over-indexes to high-minimum-wage, higher-income states (California, Washington, Oregon, Colorado, Utah — approximately 60% of the current footprint), where AUVs are estimated at ~$2.45m per store. Management’s stated growth strategy, however, prioritises expansion into lower-income southern states (Tennessee, Kentucky, Oklahoma, Louisiana, Alabama, South Carolina), where estimated AUVs are only ~$1.90m per store — approximately a 22% discount to the existing base.
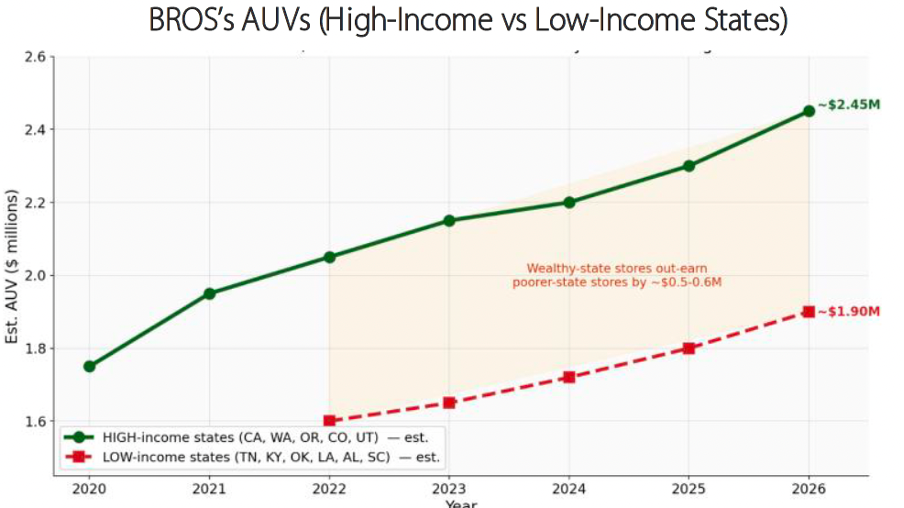
This geographic mix-shift is dilutive by construction. As the weighting of lower-AUV southern-state stores increases as a proportion of the total system, system-wide AUV will mechanically decline even if no individual store’s performance changes. The Street’s contribution margin targets assume a flat-to-improving AUV trajectory, which is inconsistent with the geographic expansion roadmap.
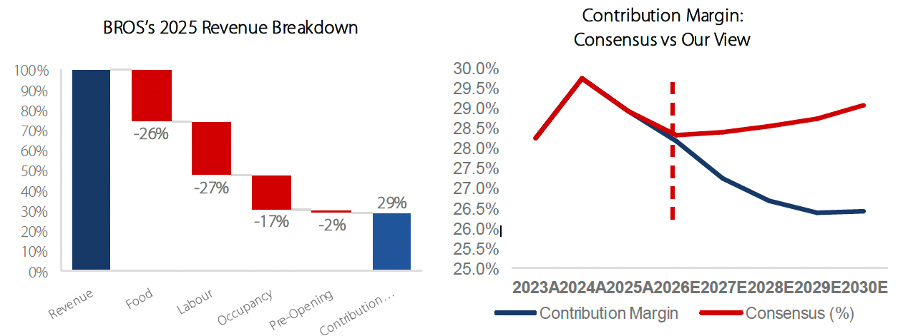
Street views that a recovery to 30%+ shop contribution by FY27, driven by Arabica normalisation, labour leverage from Order Ahead and food attach, and BTS efficiency. However, we believe that contribution margins peaked in FY25 and compressed to ~27% by FY27. BTS occupancy rents structurally higher, and labour “leverage” reverses as new shops open into lower-volume states.
The street views long-term narrative of margin expansion toward 30%+ ignoring the cost for growth initiatives (food, new markets, build-to-suit) that bulls celebrate. Beyond food costs, Dutch Bros also faces increasing labour costs. As of March 31, 2026, Dutch Bros employed approximately 24,000 hourly workers, up from ~18,000 in 2025, a 33% increase in headcount in 12 months. This headcount growth, driven by the pace of new store openings, creates significant operating deleverage sensitivity. As the company expands into lower-AUV markets, revenue per employee falls while minimum wages in existing high-cost states continue to rise. We expect labour as a percentage of revenue to remain elevated and to prevent any meaningful cost leverage from materialising.
Valuation & Scenario Analysis
We value BROS using a 5-year discounted cash flow model with a terminal value, applying a WACC of 14.4% (consistent with the implied rate from the current market price reverse DCF) and a terminal growth rate of 2.5%, which we regard as generous given the structural headwinds outlined above. Our three scenarios are as follows:
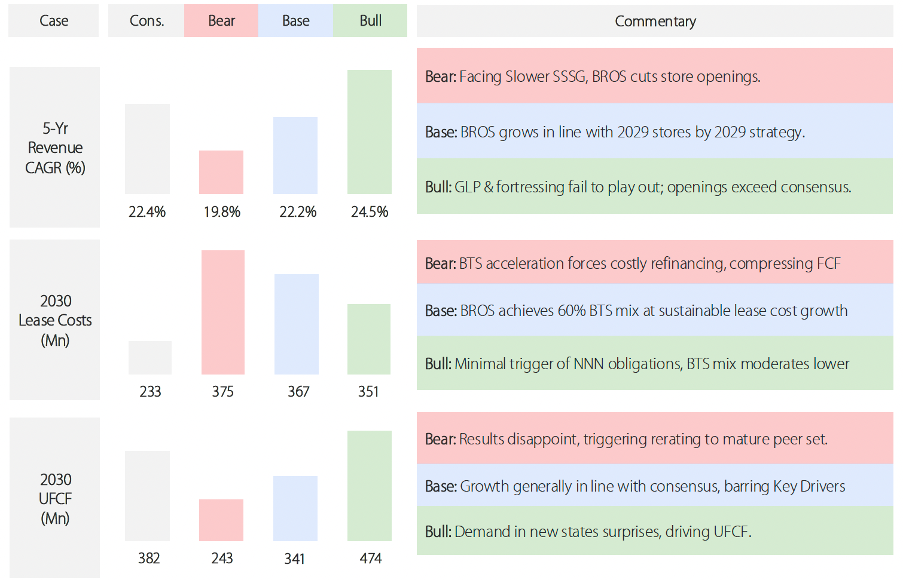
Our base case assumes BROS achieves approximately 2,029 stores by FY2029, broadly in line with management guidance, but with a 5-year revenue CAGR of 22.2% (vs. the reverse DCF-implied 34.2%) as GLP-1 drag reduces SSSG, AUV dilution from fortressing weighs on system-level productivity, and the geographic mix-shift moderates aggregate revenue per store. We assume contribution margins compress to ~27% by FY2027, versus consensus at ~30%+, reflecting the structural occupancy cost increases from BTS and reversing labour leverage.
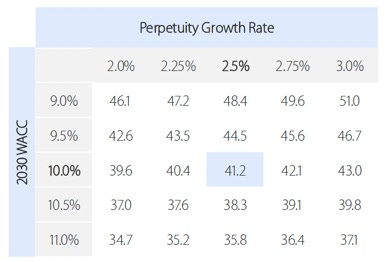
On a sensitivity basis, at a WACC of 10.0% and terminal growth rate of 2.5%, our model implies a fair value of approximately $41.20, consistent with our base case target. The valuation is robust to reasonable changes in WACC: even at 9.0% / 2.5% growth, fair value is $48.40, still below the current share price. Our bear case target of $28.49 assumes a re-rating toward the mature peer EV/EBITDA range, consistent with a scenario in which the market recognises that BROS’s growth story is structurally impaired.
The peer valuation provides further context. BROS trades at 29.5x EV/EBITDA — at a significant premium to Starbucks (24.2x), McDonald’s (16.9x), Shake Shack (16.4x), and Wendy’s (10.6x). Even taking the most generous peer multiple of Starbucks (24.2x) and applying it to our FY2026E EBITDA of ~$365m, we arrive at an EV-implied share price of approximately $51, still below current levels, and using a multiple that we view as far too generous given BROS’s structurally weaker margin trajectory.
Event Path and Risks
We identify three primary risks that could invalidate or delay the realisation of our thesis:
1. GLP-1 Adoption Slows
The most impactful risk is a delay in GLP-1 mass-market penetration, whether through Medicare coverage delays, additional FDA restrictions on the oral formulation, or slower-than-expected IRA drug price negotiation timelines. Slower adoption would push the GLP-1 SSSG drag further into the future, extending the period during which consensus SSSG forecasts are not materially wrong. That said, even for diabetes patients, GLP-1s are highly price-insensitive, meaning the structural adoption trajectory is likely to be broadly maintained regardless of pricing shifts. We view this as the most material but also the most bounded downside risk to our thesis.
2. BTS Refinancing Executes Cleanly
If BROS successfully refinances its 2030 debt and lease maturity wall at manageable rates, perhaps aided by FCF turning materially positive ahead of our projections, the balance sheet risk we identify becomes a non-event. In this scenario, the BTS lease liability stack may indeed be reframed by the market as a ‘capital-light feature’ rather than a financial burden, and the multiple could re-rate upward. We assign this low probability given the trajectory of occupancy costs already disclosed in the Q1 2026 10-Q.
3. Food Programme Becomes a Genuine Multi-Year Comp Engine
If BROS successfully achieves 10–15% food attach rates across the network, and if Arabica coffee cost normalisation unlocks meaningful COGS improvement, management’s path to 30% contribution margins within 18 months becomes credible. However, food margins are structurally lower than beverage margins, and the food programme requires incremental investment in chilled storage capacity and additional operational complexity. We view this as a high-impact but low-probability outcome.
Near-Term Event Path: Catalysts for the Short
The short thesis has a well-defined event path with multiple near-term catalysts:
Conclusion
We believe Dutch Bros is a fundamentally misunderstood business. The market has correctly identified it as a high-growth, brand-driven concept with an enthusiastic and loyal customer base. What the market has failed to price is the degree to which that growth is inorganic, AUV-dilutive and margin-destructive, financed by long-duration lease obligations that will compound into a significant refinancing constraint by 2030.
The three structural headwinds we identify, GLP-1 demand erosion, BTS financial engineering, and fortressing cannibalization are not discrete, independent risks. They are interconnected and self-reinforcing: falling SSSG from GLP-1 drag worsens the economic case for each new BTS store; new BTS stores in lower-AUV geographies drive further SSSG dilution; and the higher occupancy costs from BTS compound the margin compression from mix-shift and labour deleverage. The market is pricing none of this.
With the stock at ~29.5x EV/EBITDA against a backdrop of decelerating SSSG, rising lease obligations and a structural GLP-1 headwind inflecting in real-time, we see 27.0% downside to our blended target price of US$40.75. Our base case alone implies +26.6% downside. We maintain a short recommendation.